When it comes to plotting graphs and tracking data, Dave Lane usually looks beyond the Earth into the deep reaches of space for his information.
But these days the Saint Mary’s University astronomical technician and amateur astronomer has focused his attention on his home planet, which has been hit by the most catastrophic pandemic in over 100 years.
Lane has been posting comparative graphs of COVID-19 cases in Nova Scotia, Canada and the United States since last month on his Facebook page.
He did a trial run earlier in March using global data when cases outside of China were beginning to accumulate.
“I was just noting the exponential growth and I just didn't think at the time that people realized what that meant over time, you know, how quickly the numbers would grow,” Lane said in an interview Saturday.
“So just out of curiosity I started plotting the numbers from the Johns Hopkins site, which was keeping track of numbers across the world. And then I just said, hmm, I wonder if we take these numbers and just plot them (to) figure out what the growth is now and extend that through to the end of the month and it was showing over a million cases.”
It turned out the world did indeed hit the million-case mark around that time. It was a few days later than he predicted - on April 3 - but Lane noted his graph didn’t take into account social distancing measures put in place in many countries that may have slowed the outbreak.
Lane took his COVID-19 graphing a step further around March 24 with his comparative plotting of the situations in Nova Scotia, Canada and the U.S.
“We started to get cases and I said well, you know, there's lots of people out there now that are keeping track of the international scene and Canadian scene, so I thought yeah, what the heck, I'll just start plotting the Nova Scotian numbers just to see what was happening there.”

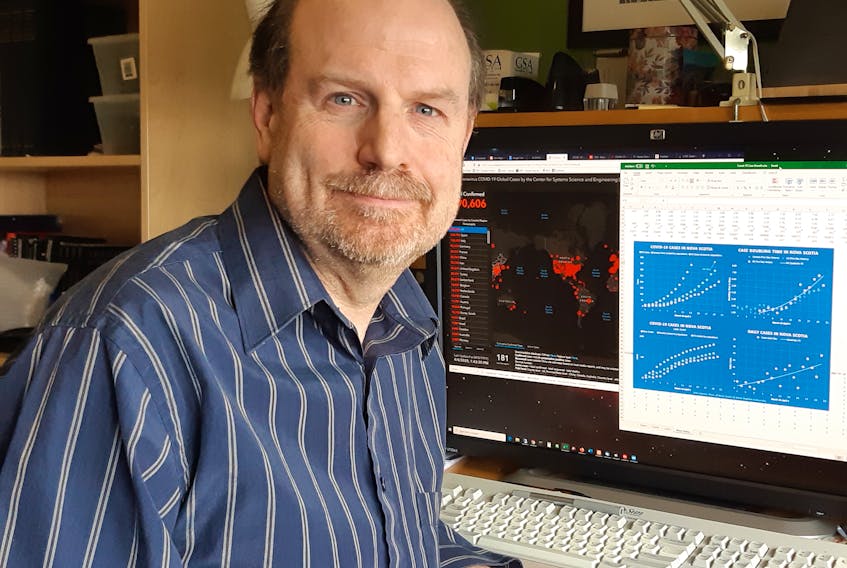
When you look at "COVID-19 cases in Nova Scotia" part of the graph, it’s clear that, at least so far, Nova Scotia has a shallow COVID curve compared to the rest of Canada and certainly the United States.
But Lane said the “case-doubling time” data on the top right is particularly relevant for Nova Scotia. In that graph, Nova Scotia’s plot line rises higher and further than the U.S. and Canada.
That’s actually good news. This kind of data line, called a quadratic fit, indicates we’re not doubling our cases in a short amount of time, as in the United States.
“For example, if today we have 100 cases in Nova Scotia and four days from now we have 200 and eight days from now we have 400, then 800 and 1,600 and so on - that's what we're trying to avoid,” he said. “So by plotting what's called the case-doubling time, that's the number of days between the doubling. If that's continuing to go up, that's a good thing because that means we're off the exponential growth.”
Lane warns that you must be careful interpreting these statistical trends as reality because the numbers are so low here.
"We have the same issue in astronomy where if you go measure a star and it's really faint, you don't have enough light," said Lane, who is the director of Saint Mary's Burke-Gaffney observatory and an award-winning member of the Royal Astronomical Society of Canada.
"It's just too difficult to measure how bright something is - you measure it and you can detect it's there but how bright it is and what the trend is you can't really tell."
As well, Nova Scotia is behind the curve, so to speak, because much of the world started getting cases before us.
But that delay has given us a window of opportunity to shut down our interactions with moves such as the state of emergency, Lane notes. He's cautiously optimistic - while emphasizing he’s no medical expert - that we’ll avoid the huge spike in cases that has slammed countries like Italy, Spain and the United States.
For now, his plotting project is an interesting diversion during these times of home isolation. And his work has caught on with his Facebook followers, one of whom has created a Facebook group, the Canadian Coronavirus Dashboard, around Lane's work.
“People have been encouraging me, hey, keep these coming."